empty
23.04.2025 04:29 AM
Trading Recommendations and Analysis for GBP/USD on April 23: Has the Market Remembered Where the "Sell" Button Is?

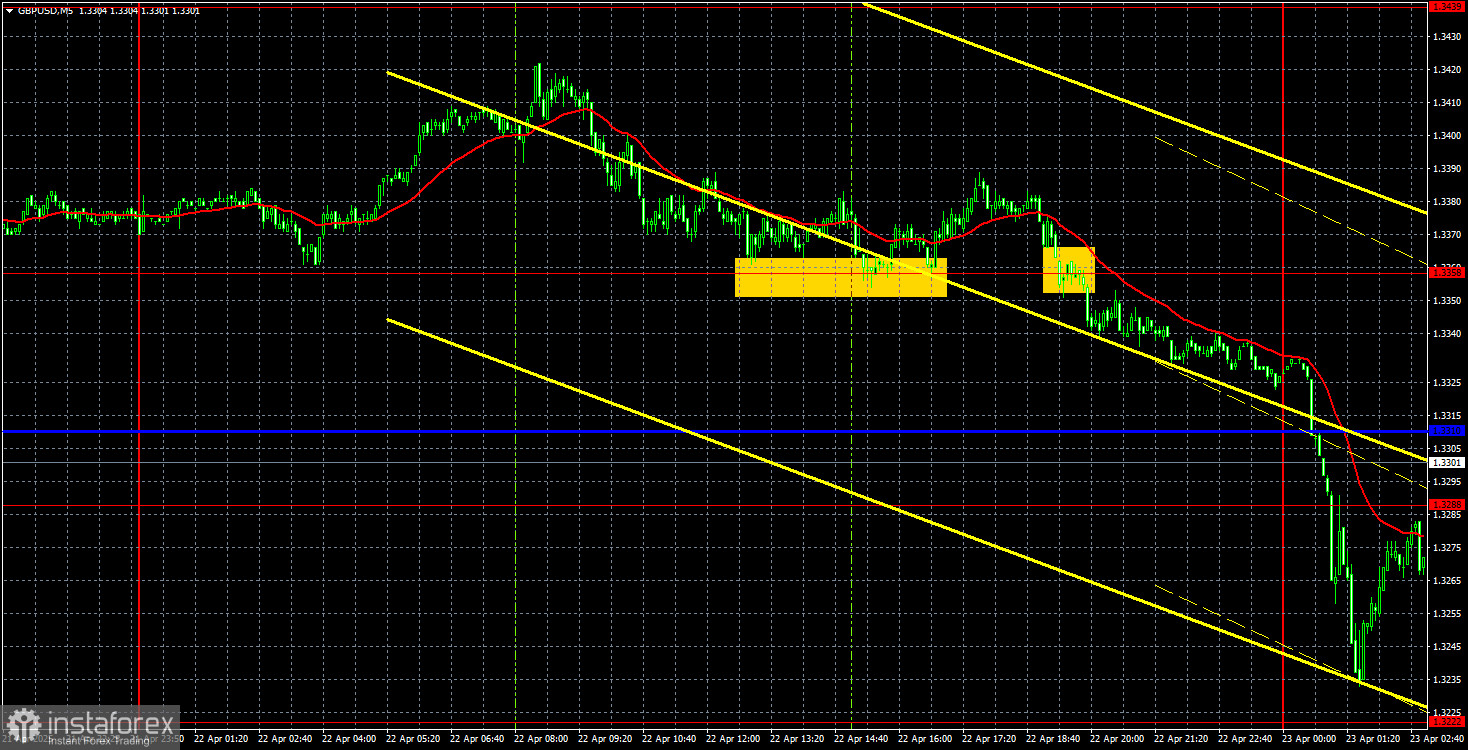
GBP/USD 5-Minute Analysis

This image is no longer relevant

On Tuesday, the GBP/USD currency pair showed very low volatility and a general lack of interest in trading. While the euro traded with a noticeable decline, the British pound mostly stood still. A significant drop only began during the night. Just take a look at the movements over the past two weeks! During this period, pullbacks and corrections were almost absent. Even with the strongest fundamental and macroeconomic background favoring the British currency, we would not expect such a one-sided move. In our view, this only means one thing—there is currently no logic in the market movements. The market receives new headlines about a possible escalation in the trade war and may sell the dollar for weeks based on a single news item. When the next phase of the dollar's decline will end is impossible to predict. Technical levels are often ignored. Chaos still reigns in the currency market and financial markets more broadly.

As we've said before, the uptrend is visible from a mile away, yet it's impossible to form a proper trendline—or a trend channel. The pair pulled back yesterday, but who can expect a substantial decline right now? Tomorrow, Donald Trump may announce new sanctions or increase tariffs on China to 500%. What market reaction can be expected?

Throughout the past day, the price rebounded several times from the 1.3358 level but never managed to move more than 20 pips in the desired direction. By the end of the day, it returned to that level again and broke below it. Afterward, during the Asian session, it dropped about 100 pips.
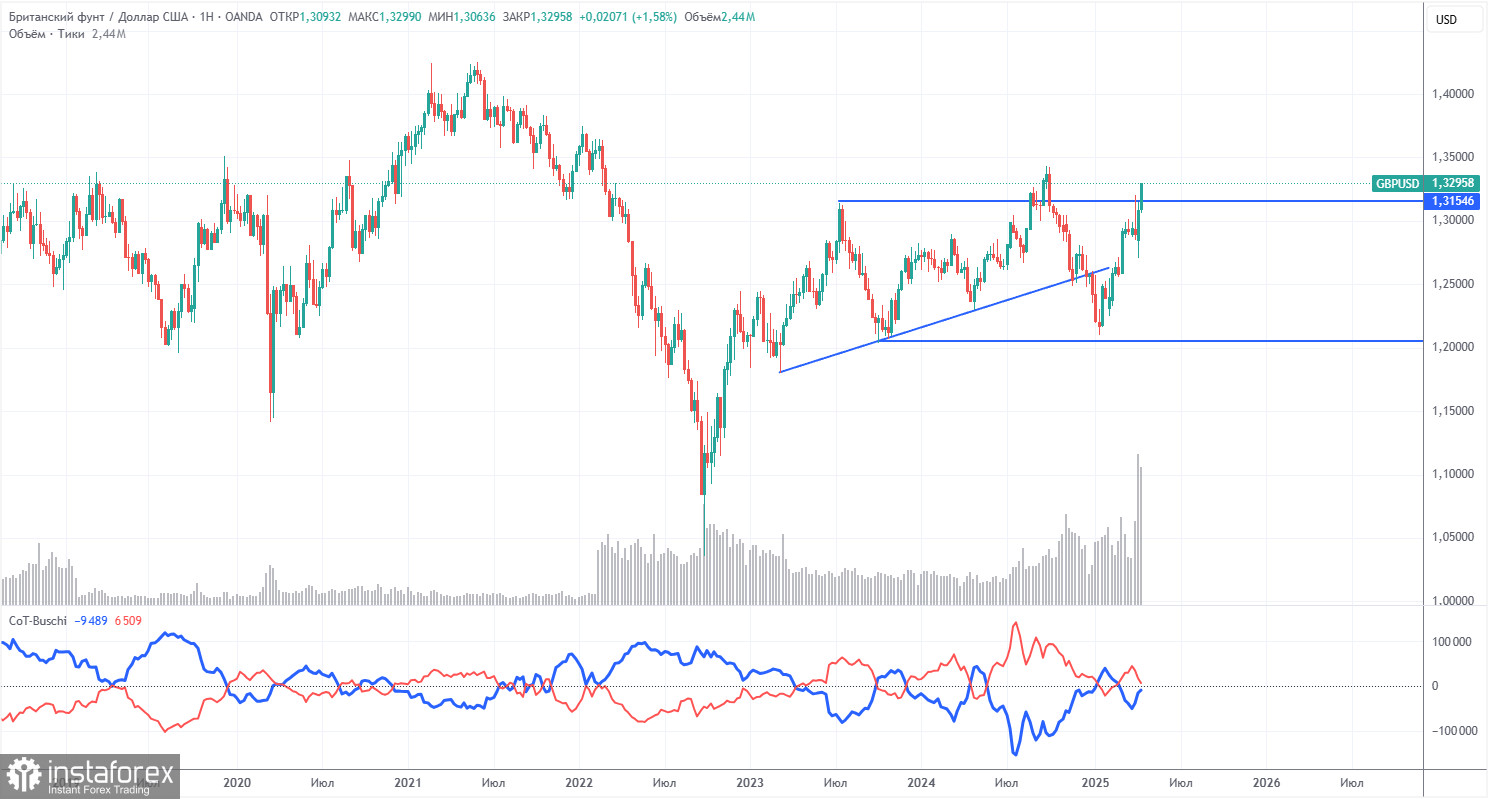
COT Report

This image is no longer relevant

COT (Commitments of Traders) reports on the British pound show that sentiment among commercial traders has been constantly shifting over recent years. The red and blue lines, representing net positions of commercial and non-commercial traders, frequently intersect and are usually close to the zero mark. This is still the case now, which indicates a roughly equal number of long and short positions.

On the weekly timeframe, the price first broke through the 1.3154 level, then overcame the trendline, returned to 1.3154, and broke it again. The breach of the trendline would typically suggest a high likelihood of further pound declines. However, we continue to see the dollar falling due to Donald Trump. Therefore, trade war news may keep pushing the pound even higher, regardless of the technical picture.

According to the latest COT report on the British pound, the "Non-commercial" group closed 6,000 BUY contracts and opened 4,700 SELL contracts. As a result, the net position of non-commercial traders has declined for the third consecutive week (-10,700 contracts), yet this hasn't had any meaningful impact on price movement.

The fundamental background still doesn't support long-term buying of the British pound, and the currency has realistic chances of continuing its long-term downtrend. The pound has risen sharply in recent months, but the reason is apparent: Trump's policy actions.

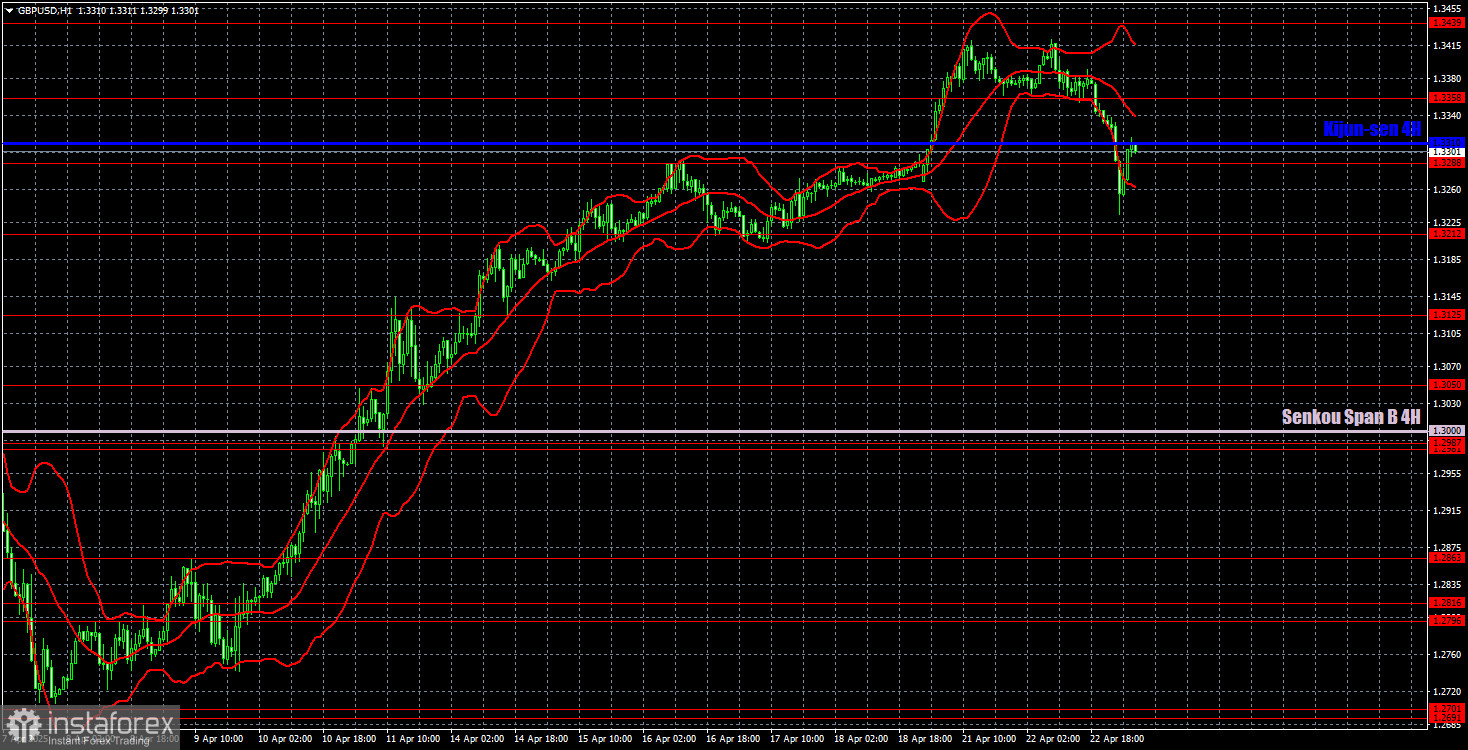
GBP/USD 1-Hour Analysis

This image is no longer relevant

On the hourly timeframe, the GBP/USD pair has shown a strong "rally" after nearly a month of sideways movement, followed by a sharper drop and now another even stronger rally, which has continued for two weeks. The British pound has posted substantial gains, although it can take no real credit. The entire upward movement of the pound is due to the decline of the dollar, triggered by Donald Trump. And that process isn't over yet. As such, chaos, panic, and confusion continue to dominate the market, while logic and consistency in movements are nowhere to be found.

For April 23, we highlight the following key levels: 1.2691–1.2701, 1.2796–1.2816, 1.2863, 1.2981–1.2987, 1.3050, 1.3125, 1.3212, 1.3288, 1.3358, 1.3439, 1.3489, 1.3537. The Senkou Span B line (1.3000) and Kijun-sen (1.3310) may also be signal sources. A Stop Loss is recommended to be moved to breakeven if the price moves 20 pips in the right direction. The Ichimoku indicator lines may shift throughout the day, which should be considered when determining trading signals.

On Wednesday, the UK and the US are scheduled to release April business activity indices, which could affect trader sentiment. However, the market may not react to these reports—or we might not even notice any market reaction at all.

Illustration Explanations:

  • Support and Resistance Levels (thick red lines): Thick red lines indicate where movement may come to an end. Please note that these lines are not sources of trading signals.
  • Kijun-sen and Senkou Span B Lines: Ichimoku indicator lines transferred from the 4-hour timeframe to the hourly timeframe. These are strong lines.
  • Extreme Levels (thin red lines): Thin red lines where the price has previously bounced. These serve as sources of trading signals.
  • Yellow Lines: Trendlines, trend channels, or any other technical patterns.
  • Indicator 1 on COT Charts: Represents the net position size for each category of traders.
Summary
Urgency
Analytic
Stanislav Polyanskiy
Start trade
Gana con los cambios en el valor de las criptomonedas con InstaForex.
Descarga MetaTrader 4 y abre tu primera operación.
  • Grand Choice
    Contest by
    InstaForex
    InstaForex always strives to help you
    fulfill your biggest dreams.
    UNIRSE AL CONCURSO

Recommended Stories

Recomendaciones para operar y análisis de las operaciones con el par GBP/USD el 7 de agosto. La libra ha recobrado el ánimo.

El par de divisas GBP/USD durante el miércoles también reanudó su movimiento ascendente, gracias a Donald Trump. Recordemos que ayer Trump impuso aranceles del 25% contra India, pero anteriormente

Paolo Greco 04:24 2025-08-07 UTC+2

Recomendaciones para operar y análisis de las operaciones con el par EUR/USD el 7 de agosto. Trump vuelve a hundir al dólar.

El par de divisas EUR/USD durante el miércoles reanudó su movimiento ascendente. El contexto macroeconómico ayer estuvo ausente tanto en la Eurozona como en EE.UU., a excepción de un informe

Paolo Greco 04:24 2025-08-07 UTC+2

Cómo operar el par EUR/USD el 6 de agosto. Consejos sencillos y análisis de operaciones para principiantes

Análisis de las operaciones del martes: Gráfico de 1H del par EUR/USD. El par de divisas EUR/USD continuó moviéndose el martes con una volatilidad mínima y exclusivamente en dirección lateral

Paolo Greco 06:35 2025-08-06 UTC+2

GBP/USD: plan para la sesión europea del 5 de agosto. Informes Commitment of Traders COT (análisis de las operaciones de ayer). Los compradores de la libra muestran cada vez más actividad

GBP/USD: plan para la sesión europea del 5 de agosto. Informes Commitment of Traders COT (análisis de las operaciones de ayer). Los compradores de la libra muestran cada

Miroslaw Bawulski 08:36 2025-08-05 UTC+2

Cómo operar el par GBP/USD el 5 de agosto. Consejos sencillos y análisis de operaciones para principiantes

El par GBP/USD el lunes tampoco mostró ningún movimiento interesante, aunque sí presentó una inclinación alcista mínima. La volatilidad fue nula, por lo que no tuvo sentido operar

Paolo Greco 08:06 2025-08-05 UTC+2

Cómo operar el par EUR/USD el 5 de agosto. Consejos sencillos y análisis de operaciones para principiantes

El par de divisas EUR/USD se movió exclusivamente de forma lateral el lunes y con una volatilidad mínima. Esperábamos que el mercado continuara procesando los eventos del viernes, pero

Paolo Greco 08:06 2025-08-05 UTC+2

GBP/USD: plan para la sesión americana del 31 de julio (análisis de las operaciones matutinas).La libra sufre otra oleada de ventas

Ayer se formaron varios puntos de entrada al mercado. Veamos el gráfico de 5 minutos y analicemos lo que ocurrió. En mi pronóstico de la mañana presté atención al nivel

Miroslaw Bawulski 07:34 2025-07-31 UTC+2

EUR/USD: plan para la sesión americana del 31 de julio (análisis de las operaciones matutinas). El dólar subió tras la decisión de la Fed

Ayer se formó solo un punto de entrada al mercado. Veamos el gráfico de 5 minutos y analicemos lo que ocurrió. En mi pronóstico de la mañana presté atención

Miroslaw Bawulski 07:34 2025-07-31 UTC+2

Recomendaciones para operar y análisis de las operaciones con el par EUR/USD para el 31 de julio. De mal en peor.

El par de divisas EUR/USD continuó con su movimiento descendente durante el miércoles. Ayer, la caída de las cotizaciones del euro y el crecimiento del dólar fue provocado, en esencia

Paolo Greco 04:00 2025-07-31 UTC+2

GBP/USD: plan para la sesión americana del 30 de julio (análisis de las operaciones matutinas). La libra intenta subirr

En mi pronóstico de la mañana presté atención al nivel de 1.3365 y planeaba tomar decisiones de entrada al mercado desde allí. Veamos el gráfico de 5 minutos y analicemos

Miroslaw Bawulski 13:20 2025-07-30 UTC+2
¿No puede hablar ahora mismo?
Ingrese su pregunta en el chat.
Widget callback
 

Dear visitor,

Your IP address shows that you are currently located in the USA. If you are a resident of the United States, you are prohibited from using the services of InstaFintech Group including online trading, online transfers, deposit/withdrawal of funds, etc.

If you think you are seeing this message by mistake and your location is not the US, kindly proceed to the website. Otherwise, you must leave the website in order to comply with government restrictions.

Why does your IP address show your location as the USA?

  • - you are using a VPN provided by a hosting company based in the United States;
  • - your IP does not have proper WHOIS records;
  • - an error occurred in the WHOIS geolocation database.

Please confirm whether you are a US resident or not by clicking the relevant button below. If you choose the wrong option, being a US resident, you will not be able to open an account with InstaForex anyway.

We are sorry for any inconvenience caused by this message.