


signal strength 1 of 5
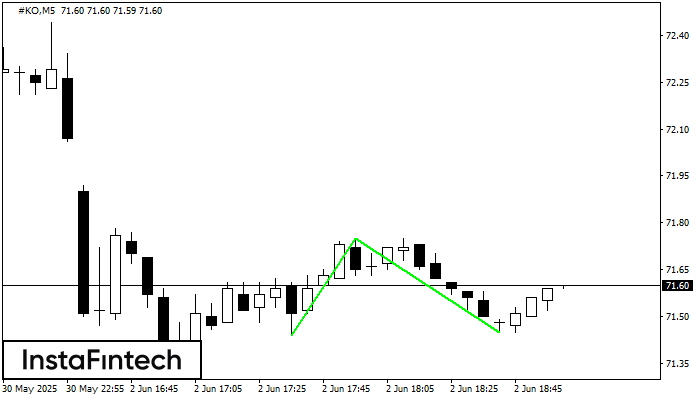
The Double Bottom pattern has been formed on #KO M5. This formation signals a reversal of the trend from downwards to upwards. The signal is that a buy trade should be opened after the upper boundary of the pattern 71.75 is broken. The further movements will rely on the width of the current pattern 31 points.
The M5 and M15 time frames may have more false entry points.
- All
- Double Top
- Flag
- Head and Shoulders
- Pennant
- Rectangle
- Triangle
- Triple top
- All
- #AAPL
- #AMZN
- #Bitcoin
- #EBAY
- #FB
- #GOOG
- #INTC
- #KO
- #MA
- #MCD
- #MSFT
- #NTDOY
- #PEP
- #TSLA
- #TWTR
- AUDCAD
- AUDCHF
- AUDJPY
- AUDUSD
- EURCAD
- EURCHF
- EURGBP
- EURJPY
- EURNZD
- EURRUB
- EURUSD
- GBPAUD
- GBPCHF
- GBPJPY
- GBPUSD
- GOLD
- NZDCAD
- NZDCHF
- NZDJPY
- NZDUSD
- SILVER
- USDCAD
- USDCHF
- USDJPY
- USDRUB
- All
- M5
- M15
- M30
- H1
- D1
- All
- Buy
- Sale
- All
- 1
- 2
- 3
- 4
- 5
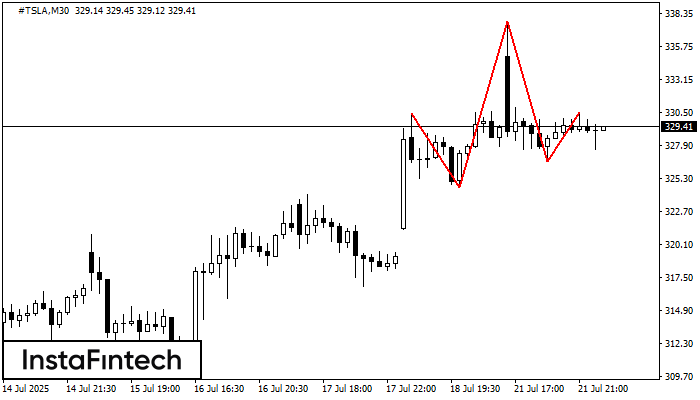
The #TSLA M30 formed the Head and Shoulders pattern with the following features: The Head’s top is at 337.71, the Neckline and the upward angle are at 324.60/326.66. The formation
Open chart in a new window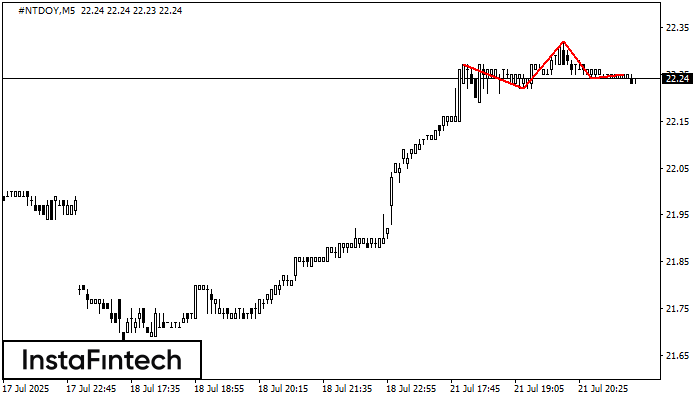
The technical pattern called Head and Shoulders has appeared on the chart of #NTDOY M5. There are weighty reasons to suggest that the price will surpass the Neckline 22.22/22.24 after
The M5 and M15 time frames may have more false entry points.
Open chart in a new window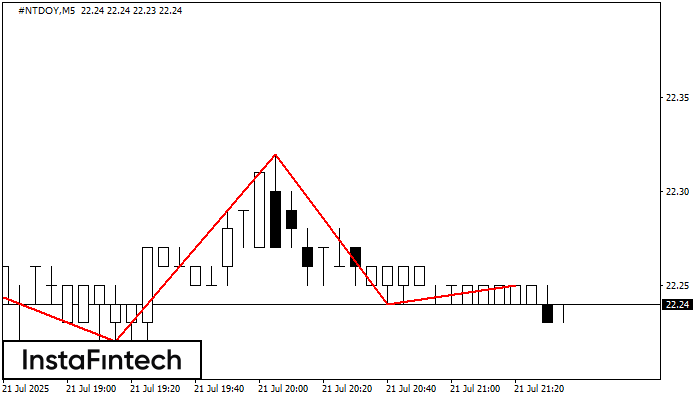
The #NTDOY M5 formed the Head and Shoulders pattern with the following features: The Head’s top is at 22.32, the Neckline and the upward angle are at 22.22/22.24. The formation
The M5 and M15 time frames may have more false entry points.
Open chart in a new window


