

signal strength 1 of 5

The Bearish pennant pattern has formed on the GBPJPY M5 chart. It signals potential continuation of the existing trend. Specifications: the pattern’s bottom has the coordinate of 194.35; the projection of the flagpole height is equal to 38 pips. In case the price breaks out the pattern’s bottom of 194.35, the downtrend is expected to continue for further level 194.20.
The M5 and M15 time frames may have more false entry points.
- All
- Double Top
- Flag
- Head and Shoulders
- Pennant
- Rectangle
- Triangle
- Triple top
- All
- #AAPL
- #AMZN
- #Bitcoin
- #EBAY
- #FB
- #GOOG
- #INTC
- #KO
- #MA
- #MCD
- #MSFT
- #NTDOY
- #PEP
- #TSLA
- #TWTR
- AUDCAD
- AUDCHF
- AUDJPY
- AUDUSD
- EURCAD
- EURCHF
- EURGBP
- EURJPY
- EURNZD
- EURRUB
- EURUSD
- GBPAUD
- GBPCHF
- GBPJPY
- GBPUSD
- GOLD
- NZDCAD
- NZDCHF
- NZDJPY
- NZDUSD
- SILVER
- USDCAD
- USDCHF
- USDJPY
- USDRUB
- All
- M5
- M15
- M30
- H1
- D1
- All
- Buy
- Sale
- All
- 1
- 2
- 3
- 4
- 5

The Double Bottom pattern has been formed on AUDCHF M30. This formation signals a reversal of the trend from downwards to upwards. The signal is that a buy trade should
Open chart in a new window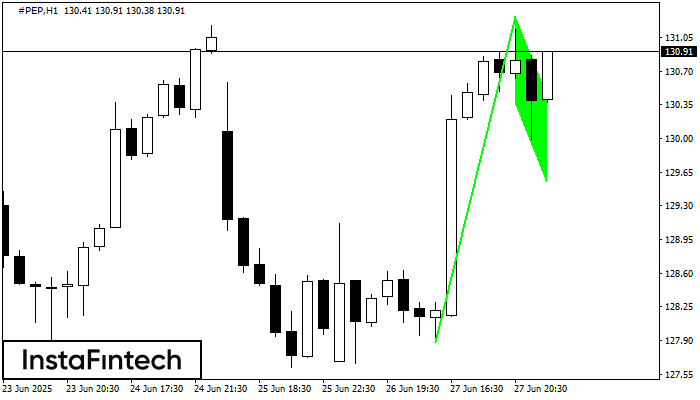
The Bullish Flag pattern has been formed on the chart #PEP H1 which signals that the upward trend will continue. Signals: а break of the peak at 131.27 may push
Open chart in a new window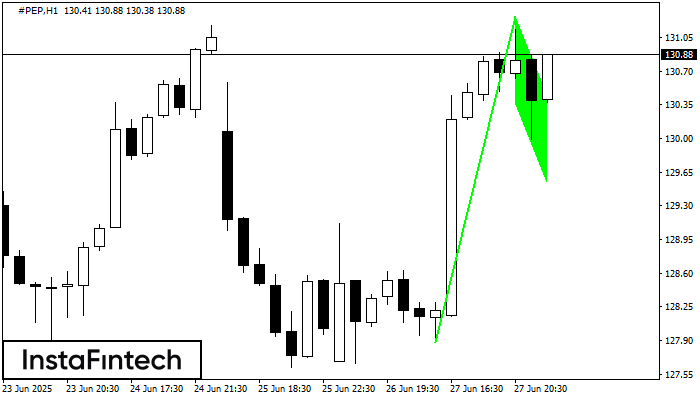
The Bullish Flag pattern has been formed on the chart #PEP H1 which signals that the upward trend will continue. Signals: а break of the peak at 131.27 may push
Open chart in a new window


