

signal strength 2 of 5
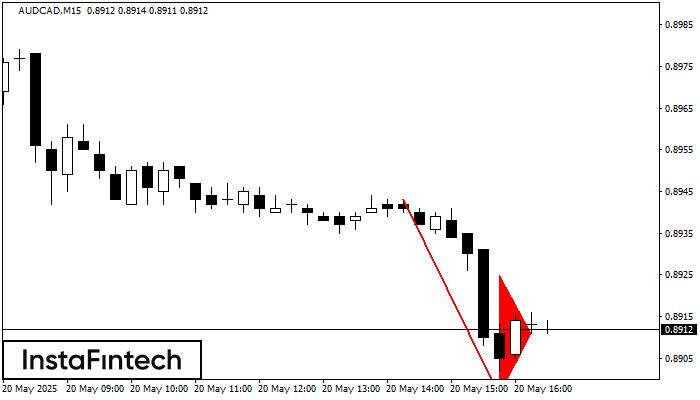
The Bearish pennant pattern has formed on the AUDCAD M15 chart. It signals potential continuation of the existing trend. Specifications: the pattern’s bottom has the coordinate of 0.8896; the projection of the flagpole height is equal to 47 pips. In case the price breaks out the pattern’s bottom of 0.8896, the downtrend is expected to continue for further level 0.8874.
The M5 and M15 time frames may have more false entry points.
- All
- Double Top
- Flag
- Head and Shoulders
- Pennant
- Rectangle
- Triangle
- Triple top
- All
- #AAPL
- #AMZN
- #Bitcoin
- #EBAY
- #FB
- #GOOG
- #INTC
- #KO
- #MA
- #MCD
- #MSFT
- #NTDOY
- #PEP
- #TSLA
- #TWTR
- AUDCAD
- AUDCHF
- AUDJPY
- AUDUSD
- EURCAD
- EURCHF
- EURGBP
- EURJPY
- EURNZD
- EURRUB
- EURUSD
- GBPAUD
- GBPCHF
- GBPJPY
- GBPUSD
- GOLD
- NZDCAD
- NZDCHF
- NZDJPY
- NZDUSD
- SILVER
- USDCAD
- USDCHF
- USDJPY
- USDRUB
- All
- M5
- M15
- M30
- H1
- D1
- All
- Buy
- Sale
- All
- 1
- 2
- 3
- 4
- 5
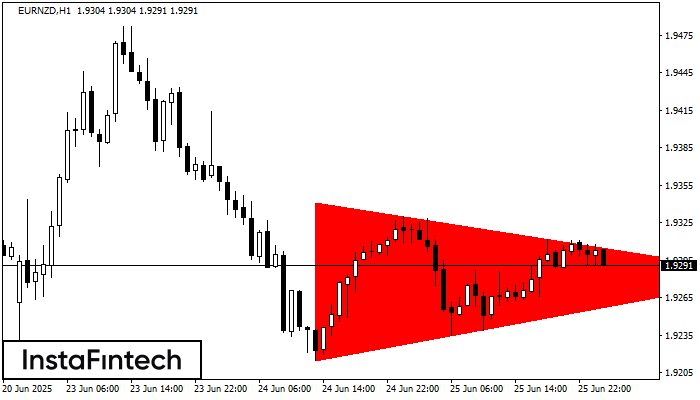
According to the chart of H1, EURNZD formed the Bearish Symmetrical Triangle pattern. This pattern signals a further downward trend in case the lower border 1.9215 is breached. Here
Open chart in a new window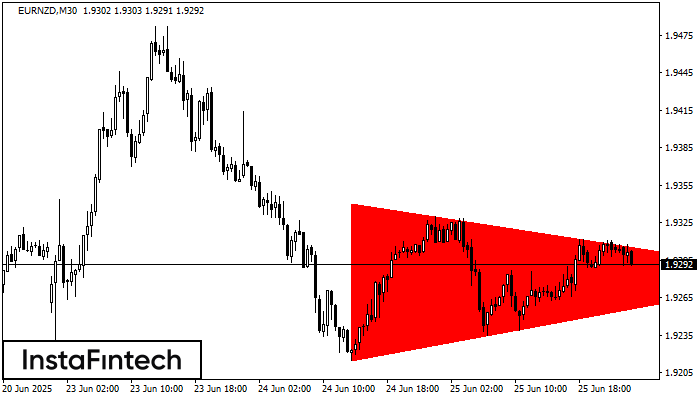
According to the chart of M30, EURNZD formed the Bearish Symmetrical Triangle pattern. Trading recommendations: A breach of the lower border 1.9215 is likely to encourage a continuation
Open chart in a new window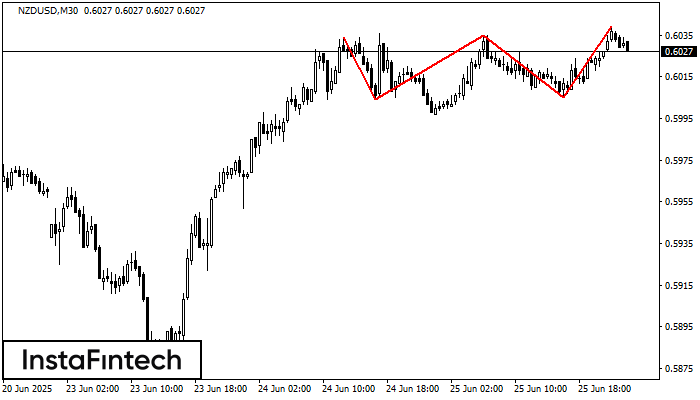
The Triple Top pattern has formed on the chart of the NZDUSD M30 trading instrument. It is a reversal pattern featuring the following characteristics: resistance level -5, support level -1
Open chart in a new window


