

signal strength 2 of 5
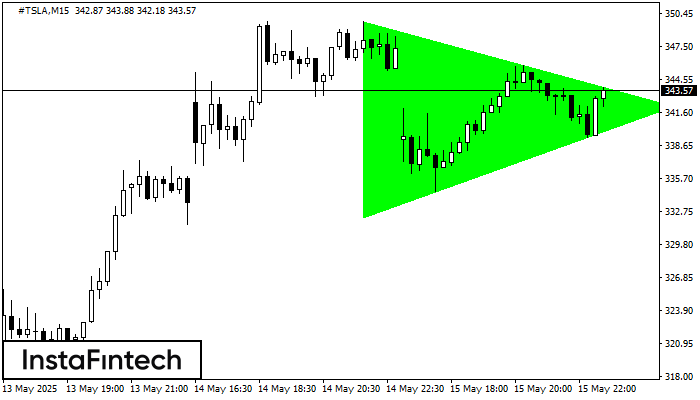
According to the chart of M15, #TSLA formed the Bullish Symmetrical Triangle pattern. The lower border of the pattern touches the coordinates 332.24/342.17 whereas the upper border goes across 349.71/342.17. If the Bullish Symmetrical Triangle pattern is in progress, this evidently signals a further upward trend. In other words, in case the scenario comes true, the price of #TSLA will breach the upper border to head for 342.39.
The M5 and M15 time frames may have more false entry points.
আরও দেখুন
- All
- Double Top
- Flag
- Head and Shoulders
- Pennant
- Rectangle
- Triangle
- Triple top
- All
- #AAPL
- #AMZN
- #Bitcoin
- #EBAY
- #FB
- #GOOG
- #INTC
- #KO
- #MA
- #MCD
- #MSFT
- #NTDOY
- #PEP
- #TSLA
- #TWTR
- AUDCAD
- AUDCHF
- AUDJPY
- AUDUSD
- EURCAD
- EURCHF
- EURGBP
- EURJPY
- EURNZD
- EURRUB
- EURUSD
- GBPAUD
- GBPCHF
- GBPJPY
- GBPUSD
- GOLD
- NZDCAD
- NZDCHF
- NZDJPY
- NZDUSD
- SILVER
- USDCAD
- USDCHF
- USDJPY
- USDRUB
- All
- M5
- M15
- M30
- H1
- D1
- All
- Buy
- Sale
- All
- 1
- 2
- 3
- 4
- 5
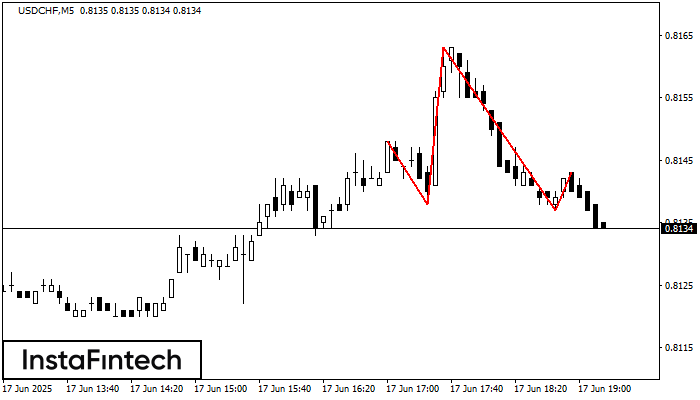
The technical pattern called Head and Shoulders has appeared on the chart of USDCHF M5. There are weighty reasons to suggest that the price will surpass the Neckline 0.8138/0.8137 after
The M5 and M15 time frames may have more false entry points.
Open chart in a new window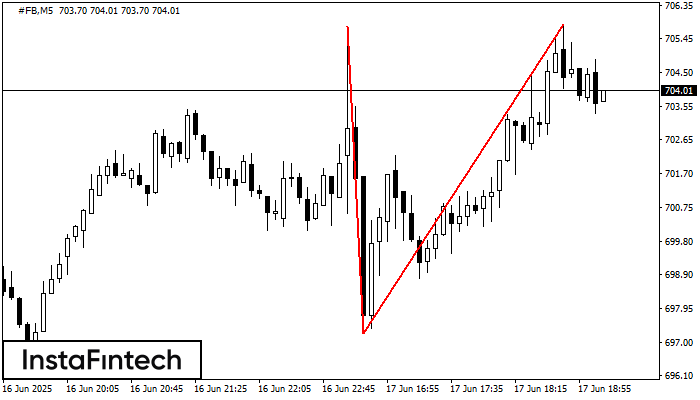
The Double Top reversal pattern has been formed on #FB M5. Characteristics: the upper boundary 705.77; the lower boundary 697.27; the width of the pattern is 857 points. Sell trades
The M5 and M15 time frames may have more false entry points.
Open chart in a new window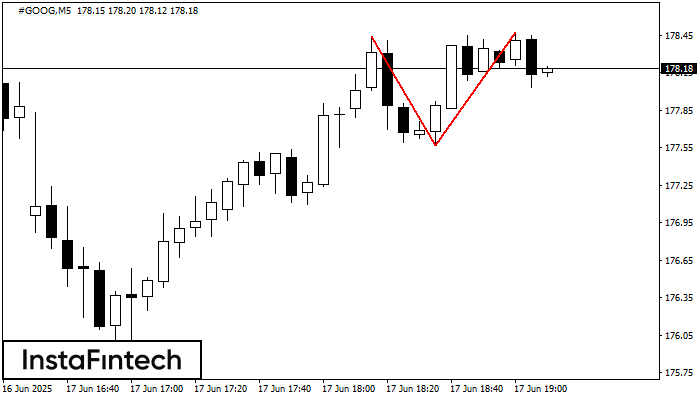
The Double Top pattern has been formed on #GOOG M5. It signals that the trend has been changed from upwards to downwards. Probably, if the base of the pattern 177.57
The M5 and M15 time frames may have more false entry points.
Open chart in a new window


