


signal strength 2 of 5
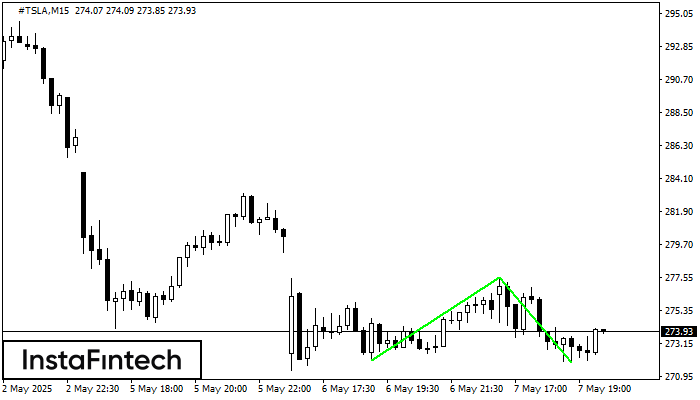
The Double Bottom pattern has been formed on #TSLA M15. Characteristics: the support level 272.03; the resistance level 277.52; the width of the pattern 549 points. If the resistance level is broken, a change in the trend can be predicted with the first target point lying at the distance of 560 points.
The M5 and M15 time frames may have more false entry points.
আরও দেখুন
- All
- Double Top
- Flag
- Head and Shoulders
- Pennant
- Rectangle
- Triangle
- Triple top
- All
- #AAPL
- #AMZN
- #Bitcoin
- #EBAY
- #FB
- #GOOG
- #INTC
- #KO
- #MA
- #MCD
- #MSFT
- #NTDOY
- #PEP
- #TSLA
- #TWTR
- AUDCAD
- AUDCHF
- AUDJPY
- AUDUSD
- EURCAD
- EURCHF
- EURGBP
- EURJPY
- EURNZD
- EURRUB
- EURUSD
- GBPAUD
- GBPCHF
- GBPJPY
- GBPUSD
- GOLD
- NZDCAD
- NZDCHF
- NZDJPY
- NZDUSD
- SILVER
- USDCAD
- USDCHF
- USDJPY
- USDRUB
- All
- M5
- M15
- M30
- H1
- D1
- All
- Buy
- Sale
- All
- 1
- 2
- 3
- 4
- 5
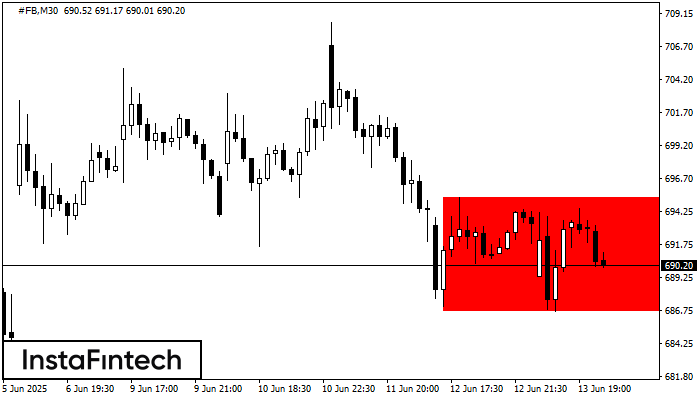
According to the chart of M30, #FB formed the Bearish Rectangle. This type of a pattern indicates a trend continuation. It consists of two levels: resistance 695.27 - 0.00
Open chart in a new window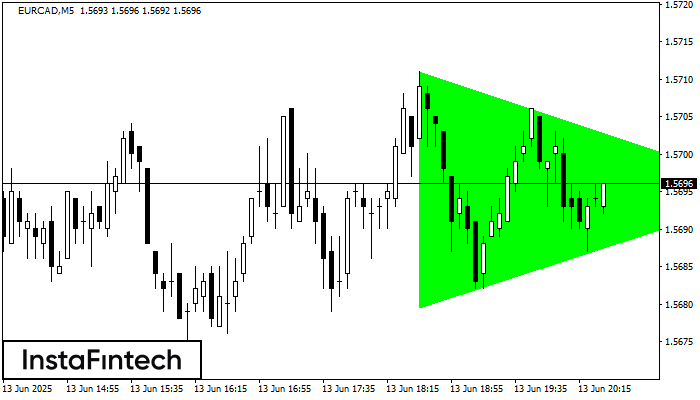
According to the chart of M5, EURCAD formed the Bullish Symmetrical Triangle pattern, which signals the trend will continue. Description. The upper border of the pattern touches the coordinates 1.5711/1.5695
The M5 and M15 time frames may have more false entry points.
Open chart in a new window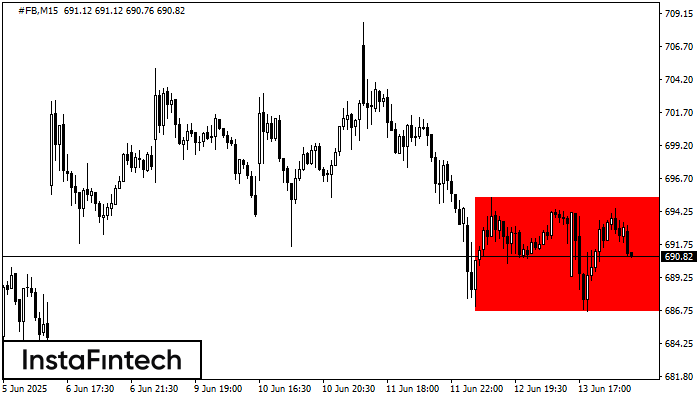
According to the chart of M15, #FB formed the Bearish Rectangle. The pattern indicates a trend continuation. The upper border is 695.27, the lower border is 686.69. The signal means
The M5 and M15 time frames may have more false entry points.
Open chart in a new window


