


signal strength 1 of 5

The Bearish Flag pattern has been formed on the chart AUDCAD M5. Therefore, the downwards trend is likely to continue in the nearest term. As soon as the price breaks below the low at 0.8835, traders should enter the market.
The M5 and M15 time frames may have more false entry points.
আরও দেখুন
- All
- Double Top
- Flag
- Head and Shoulders
- Pennant
- Rectangle
- Triangle
- Triple top
- All
- #AAPL
- #AMZN
- #Bitcoin
- #EBAY
- #FB
- #GOOG
- #INTC
- #KO
- #MA
- #MCD
- #MSFT
- #NTDOY
- #PEP
- #TSLA
- #TWTR
- AUDCAD
- AUDCHF
- AUDJPY
- AUDUSD
- EURCAD
- EURCHF
- EURGBP
- EURJPY
- EURNZD
- EURRUB
- EURUSD
- GBPAUD
- GBPCHF
- GBPJPY
- GBPUSD
- GOLD
- NZDCAD
- NZDCHF
- NZDJPY
- NZDUSD
- SILVER
- USDCAD
- USDCHF
- USDJPY
- USDRUB
- All
- M5
- M15
- M30
- H1
- D1
- All
- Buy
- Sale
- All
- 1
- 2
- 3
- 4
- 5
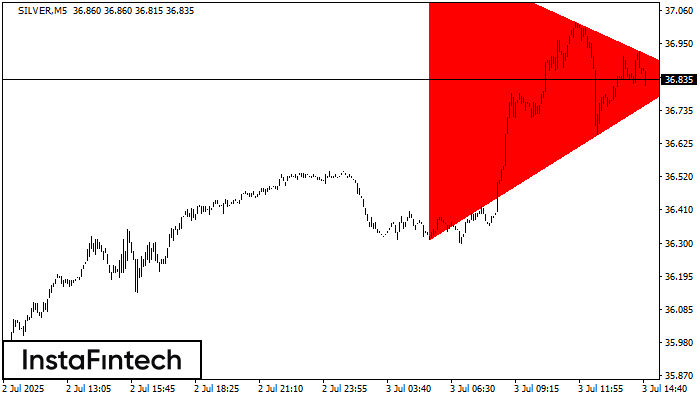
According to the chart of M5, SILVER formed the Bearish Symmetrical Triangle pattern. Trading recommendations: A breach of the lower border 36.31 is likely to encourage a continuation
The M5 and M15 time frames may have more false entry points.
Open chart in a new window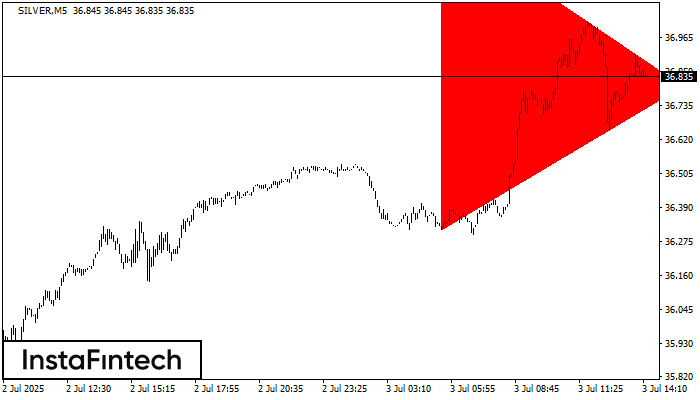
According to the chart of M5, SILVER formed the Bearish Symmetrical Triangle pattern. Trading recommendations: A breach of the lower border 36.31 is likely to encourage a continuation
The M5 and M15 time frames may have more false entry points.
Open chart in a new window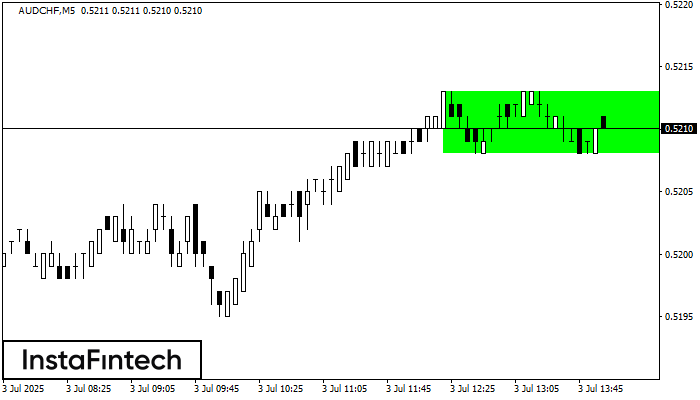
According to the chart of M5, AUDCHF formed the Bullish Rectangle which is a pattern of a trend continuation. The pattern is contained within the following borders: the lower border
The M5 and M15 time frames may have more false entry points.
Open chart in a new window


