


was formed on 27.05 at 21:55:18 (UTC+0)
signal strength 1 of 5
signal strength 1 of 5
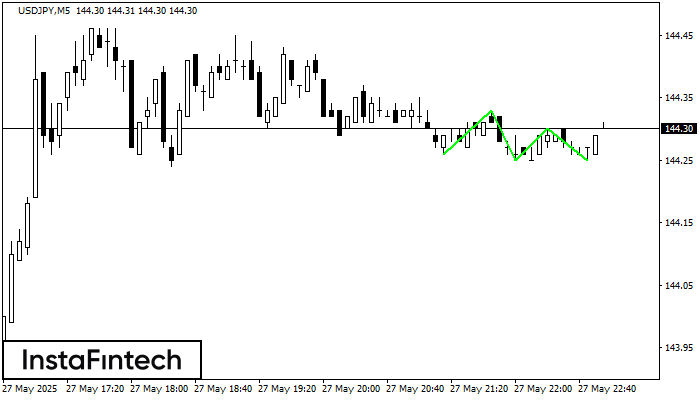
The Triple Bottom pattern has formed on the chart of the USDJPY M5 trading instrument. The pattern signals a change in the trend from downwards to upwards in the case of breakdown of 144.33/144.30.
The M5 and M15 time frames may have more false entry points.
Figure
Instrument
Timeframe
Trend
Signal Strength


