empty
сформирован 05.05 в 16:29:44 (UTC+0)
сила сигнала 4 из 5
Тройная вершина #TSLA H1

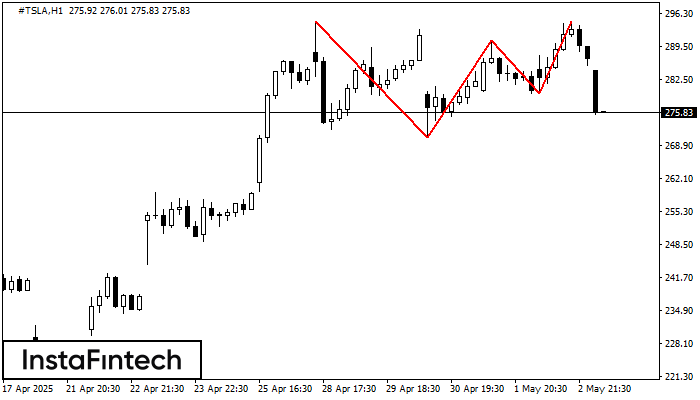
На графике #TSLA H1 образовалась фигура «Тройная вершина», которая сигнализирует об изменении тенденции. Возможный сценарий: После формирования третьей вершины котировка постарается пробить нижнюю границу 279.63, где трейдеру и стоило бы открывать торговую позицию на продажу. Тейк Профит - это и есть проекция ширины фигуры, которая составляет 1093 пунктов.

Шунингдек кўринг

Фигура
  • Все
  • Вымпел
  • Голова и плечи
  • Двойная вершина
  • Прямоугольник
  • Треугольник
  • Тройная вершина
  • Флаг
Инструмент
  • Все
  • #AAPL
  • #AMZN
  • #Bitcoin
  • #EBAY
  • #FB
  • #GOOG
  • #INTC
  • #KO
  • #MA
  • #MCD
  • #MSFT
  • #NTDOY
  • #PEP
  • #TSLA
  • #TWTR
  • AUDCAD
  • AUDCHF
  • AUDJPY
  • AUDUSD
  • EURCAD
  • EURCHF
  • EURGBP
  • EURJPY
  • EURNZD
  • EURRUB
  • EURUSD
  • GBPAUD
  • GBPCHF
  • GBPJPY
  • GBPUSD
  • GOLD
  • NZDCAD
  • NZDCHF
  • NZDJPY
  • NZDUSD
  • SILVER
  • USDCAD
  • USDCHF
  • USDJPY
  • USDRUB
Таймфрейм
  • Все
  • M5
  • M15
  • M30
  • H1
  • D1
Тренд
  • Все
  • Покупка
  • Продажа
Сила сигнала
  • Все
  • 1
  • 2
  • 3
  • 4
  • 5
Bearish Symmetrical Triangle
was formed on 02.06 at 21:58:20 (UTC+0)
signal strength 1 of 5
Bearish Symmetrical Triangle GBPAUD M5

According to the chart of M5, GBPAUD formed the Bearish Symmetrical Triangle pattern. Description: The lower border is 2.0844/2.0851 and upper border is 2.0859/2.0851. The pattern width is measured

The M5 and M15 time frames may have more false entry points.

Open chart in a new window
Double Top
was formed on 02.06 at 21:45:24 (UTC+0)
signal strength 1 of 5
Double Top #GOOG M5

On the chart of #GOOG M5 the Double Top reversal pattern has been formed. Characteristics: the upper boundary 170.53; the lower boundary 169.46; the width of the pattern 107 points

The M5 and M15 time frames may have more false entry points.

Open chart in a new window
Bullish Rectangle
was formed on 02.06 at 21:36:21 (UTC+0)
signal strength 3 of 5
Bullish Rectangle GBPUSD M30

According to the chart of M30, GBPUSD formed the Bullish Rectangle. This type of a pattern indicates a trend continuation. It consists of two levels: resistance 1.3558 and support 1.3516

Open chart in a new window
Ҳозир телефон орқали гаплаша олмайсизми?
Саволингизни беринг чатда.
Обратный звонок
 

Dear visitor,

Your IP address shows that you are currently located in the USA. If you are a resident of the United States, you are prohibited from using the services of InstaFintech Group including online trading, online transfers, deposit/withdrawal of funds, etc.

If you think you are seeing this message by mistake and your location is not the US, kindly proceed to the website. Otherwise, you must leave the website in order to comply with government restrictions.

Why does your IP address show your location as the USA?

  • - you are using a VPN provided by a hosting company based in the United States;
  • - your IP does not have proper WHOIS records;
  • - an error occurred in the WHOIS geolocation database.

Please confirm whether you are a US resident or not by clicking the relevant button below. If you choose the wrong option, being a US resident, you will not be able to open an account with InstaForex anyway.

We are sorry for any inconvenience caused by this message.