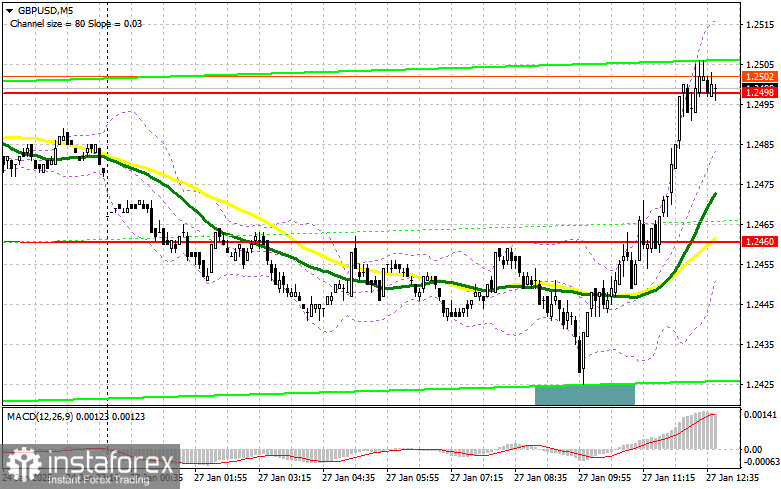
In my morning forecast, I focused on the 1.2420 level and planned to make trading decisions from there. Let's take a look at the 5-minute chart and analyze what happened. The decline occurred, but the level was not tested, leaving me without trades in the first half of the day. I also refrained from selling at 1.2460, as I no longer felt inclined to go against the trend. The technical picture has been revised for the second half of the day.
For Opening Long Positions on GBP/USD:
The absence of UK statistics unexpectedly helped pound buyers return to the market. Now, the focus shifts to U.S. data, which could support the dollar, provided the figures exceed expectations. While new home sales are not the most critical indicator for the forex market, they still play a significant role in the economy.
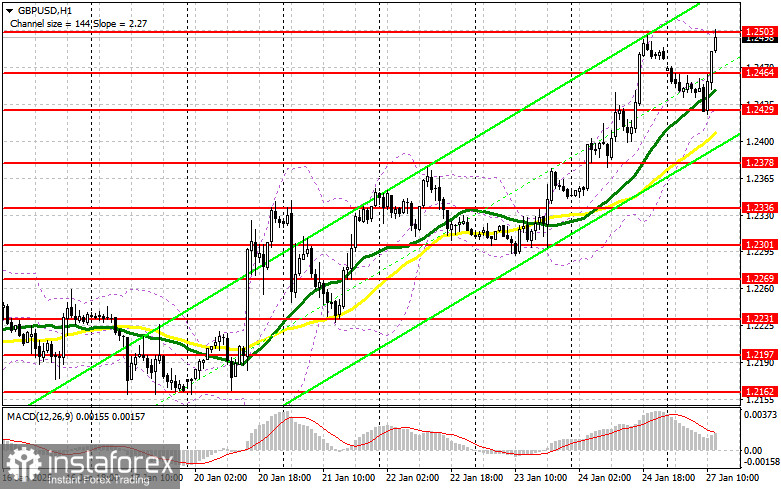
In the event of a bearish reaction to the data, I plan to buy only after forming a false breakout around the new support at 1.2464, which acts as an intermediate level. The target will be a recovery to the resistance at 1.2503, where I expect the first significant seller activity. A breakout and a retest of this range from above will create a new entry point for long positions, targeting 1.2543, which will strengthen the bullish trend. The farthest target will be the 1.2571 level, where I plan to take profit.
If GBP/USD declines and bulls are inactive at 1.2464, the pound risks consolidating in a sideways channel. In that case, only a false breakout at the 1.2429 low would provide suitable conditions for opening long positions. I will consider buying GBP/USD immediately on a rebound from the 1.2378 low, targeting a 30–35 point upward correction within the day.
For Opening Short Positions on GBP/USD:
Sellers have not shown significant activity after the Asian sell-off, raising questions about the presence of large players. If GBP/USD continues to rise on weak U.S. data, it will be important to watch the nearest resistance at 1.2503, which could be tested shortly. A false breakout formation there, following the release of U.S. statistics, will provide a good entry point for short positions, targeting a decline to the 1.2464 level.
A breakout and a retest of 1.2464 from below would trigger stop orders, paving the way to 1.2429, where the moving averages are positioned, favoring bulls. The farthest target will be the 1.2378 level, where I plan to take profit.
If demand for the pound persists in the second half of the day and bears fail to act around 1.2503, the bullish trend will likely continue. In this scenario, I will postpone short positions until testing resistance at 1.2543. I will only sell there after a failed consolidation. If there is no downward movement at that level, I will look for short positions on a rebound from 1.2571, targeting a 30–35 point downward correction.
Commitments of Traders (COT) Report:
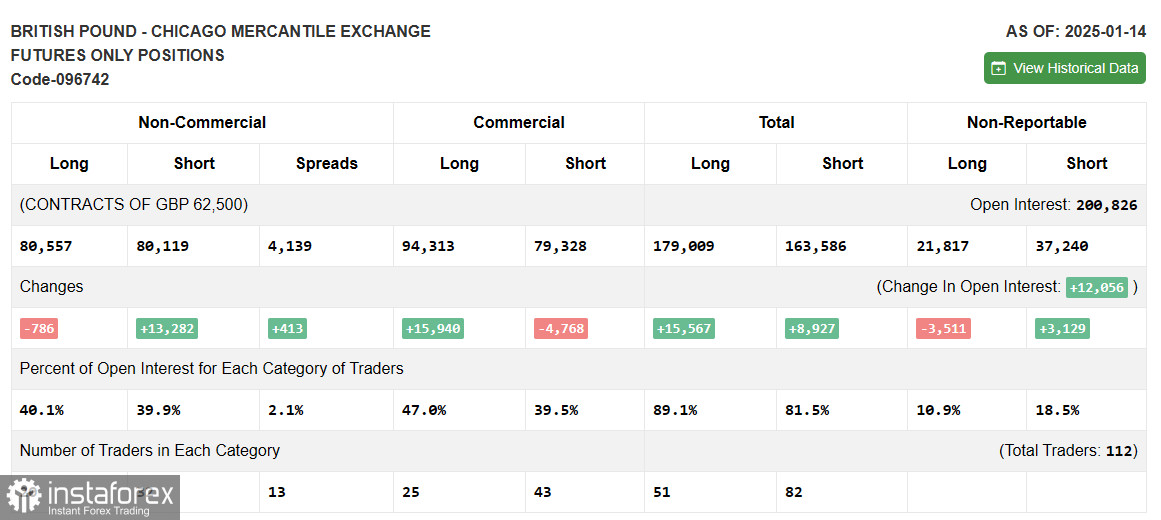
The COT report for January 14 showed a sharp increase in short positions and a reduction in long ones. The balance of power has shifted significantly. The market is currently at a turning point, with an almost equal number of buyers and sellers—a situation not favorable for bulls. Upcoming labor market data, combined with weak GDP growth and high inflation in the UK, cast doubt on the Bank of England's next moves. Will the regulator cut rates amid these challenges? It's a difficult question.
The latest COT report showed that long non-commercial positions decreased by 786, to 80,557, while short non-commercial positions increased by 13,282, to 80,119. As a result, the gap between long and short positions grew by 413.
Indicator Signals
Moving AveragesTrading is conducted above the 30- and 50-day moving averages, indicating further pound growth.
Note: The moving averages analyzed here are based on the hourly H1 chart and differ from the classical daily moving averages on the D1 chart.
Bollinger Bands:If the pair declines, the lower boundary of the indicator at 1.2429 will act as support.
Indicator Descriptions:
- Moving Average (MA): Determines the current trend by smoothing out volatility and noise.
- Period – 50: Marked in yellow on the chart.
- Period – 30: Marked in green on the chart.
- MACD (Moving Average Convergence/Divergence): Fast EMA – period 12, Slow EMA – period 26, SMA – period 9.
- Bollinger Bands: Period – 20.
- Non-commercial traders: Speculators such as individual traders, hedge funds, and large institutions using the futures market for speculative purposes.
- Long non-commercial positions: Total long open positions of non-commercial traders.
- Short non-commercial positions: Total short open positions of non-commercial traders.
- Net non-commercial position: The difference between short and long positions of non-commercial traders.