signal strength 1 of 5

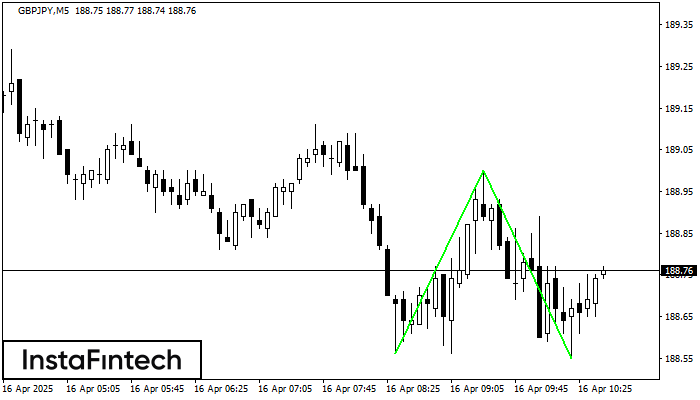
The Double Bottom pattern has been formed on GBPJPY M5; the upper boundary is 189.00; the lower boundary is 188.55. The width of the pattern is 44 points. In case of a break of the upper boundary 189.00, a change in the trend can be predicted where the width of the pattern will coincide with the distance to a possible take profit level.
The M5 and M15 time frames may have more false entry points.
See Also
- All
- Double Top
- Flag
- Head and Shoulders
- Pennant
- Rectangle
- Triangle
- Triple top
- All
- #AAPL
- #AMZN
- #Bitcoin
- #EBAY
- #FB
- #GOOG
- #INTC
- #KO
- #MA
- #MCD
- #MSFT
- #NTDOY
- #PEP
- #TSLA
- #TWTR
- AUDCAD
- AUDCHF
- AUDJPY
- AUDUSD
- EURCAD
- EURCHF
- EURGBP
- EURJPY
- EURNZD
- EURRUB
- EURUSD
- GBPAUD
- GBPCHF
- GBPJPY
- GBPUSD
- GOLD
- NZDCAD
- NZDCHF
- NZDJPY
- NZDUSD
- SILVER
- USDCAD
- USDCHF
- USDJPY
- USDRUB
- All
- M5
- M15
- M30
- H1
- D1
- All
- Buy
- Sale
- All
- 1
- 2
- 3
- 4
- 5
The Double Top pattern has been formed on NZDUSD M5. It signals that the trend has been changed from upwards to downwards. Probably, if the base of the pattern 0.6001
The M5 and M15 time frames may have more false entry points.
Open chart in a new windowThe Double Top reversal pattern has been formed on NZDCAD M5. Characteristics: the upper boundary 0.8241; the lower boundary 0.8207; the width of the pattern is 33 points. Sell trades
The M5 and M15 time frames may have more false entry points.
Open chart in a new windowThe Bullish Flag pattern which signals continuation of a trend has been formed on the chart EURNZD M15. Forecast: if the price breaks above the pattern high at 1.9179, then
The M5 and M15 time frames may have more false entry points.
Open chart in a new window