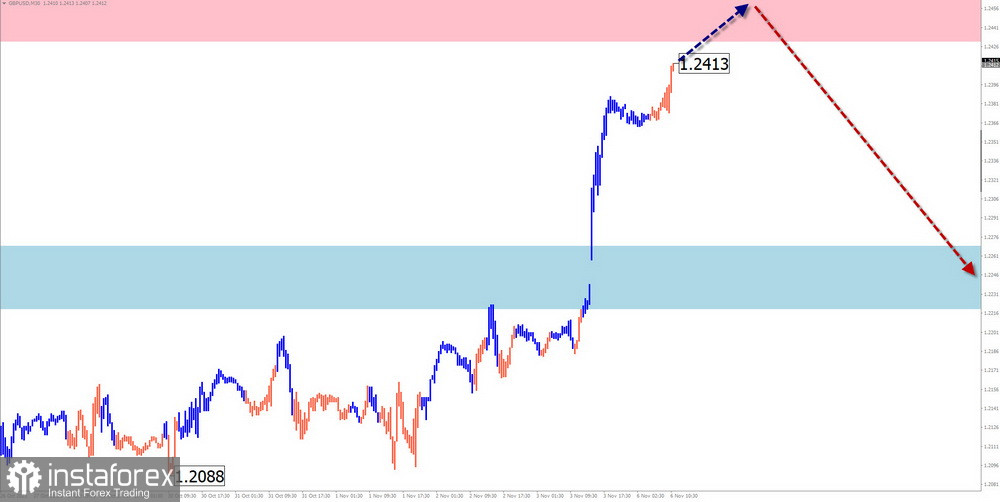
GBP/USD
Brief Analysis:
The direction of the short-term trend of the British pound sterling has been defined by a bearish wave since mid-July of this year. In the structure of this wave, the middle part (B) started on October 4th. At the end of the previous week, quotes moved upward from the border of a strong, potentially reversal zone on the weekly chart.
Week Forecast:
The beginning of the current week is expected to be flatter than the previous segment. Price movements for the British pound are likely to occur in a sideways range, with a possible shift in price towards the resistance zone. In the second half of the week, an intensification and resumption of the bearish course of the pair's movement can be expected.
Potential Reversal Zones:
Resistance:
Support:
Recommendations:
Selling: This will become possible after the appearance of signals from your trading systems in the resistance zone.
Buying: Fractional lots are permissible within individual sessions.
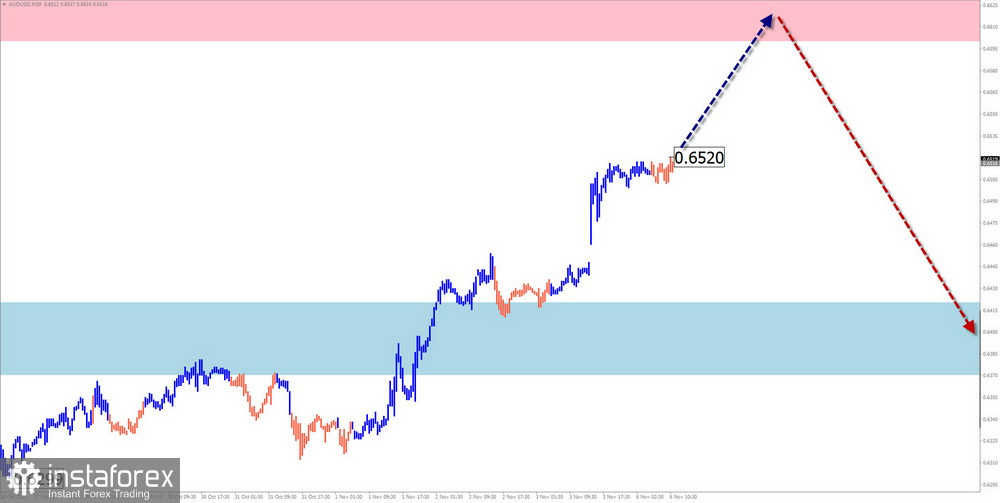
AUD/USD
Brief Analysis:
Within the dominant bearish trend, the quotes of the Australian dollar have been forming a corrective segment of movement since mid-October. Its range does not exceed the scale of the correction of the last segment of the main wave. The final section is being developed in the structure of this wave.
Week Forecast:
At the beginning of the upcoming week, an upward price movement is more likely. Price growth is expected to be not far from the calculated resistance zone. An increase in volatility and the resumption of a price decline can be expected closer to the weekend.
Potential Reversal Zones:
Resistance:
Support:
Recommendations:
Buying: Due to the limited potential for an upward move, it may be risky. It is wiser to reduce the trading volume.
Selling: This will be relevant after the appearance of corresponding signals in the support zone from your used trading systems.
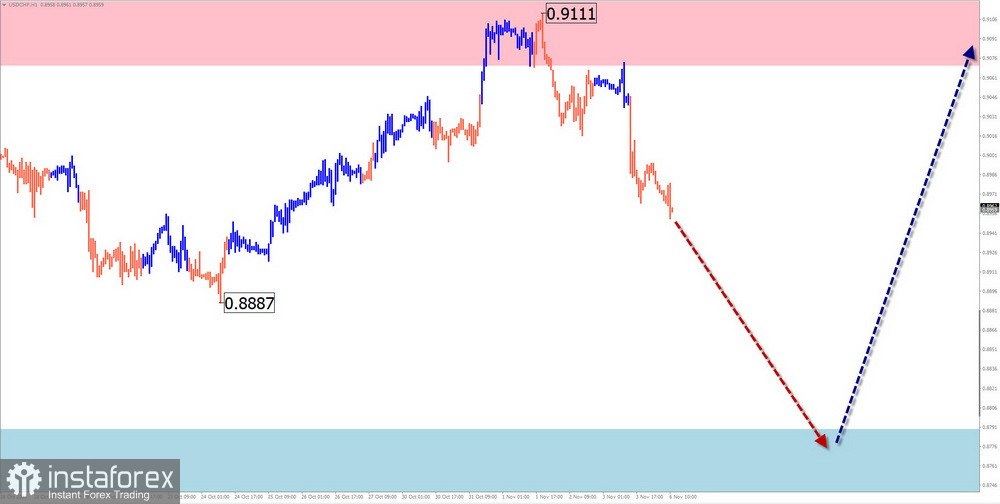
USD/CHF
Brief Analysis:
Analysis of the daily chart of the Swiss franc shows the formation of an upward wave since July 14th. The descending section of the chart, which started on October 3rd, forms a correction part (B) of this wave. The level of the calculated support delineates the upper boundary of the preliminary target zone, which is the nearest target.
Week Forecast:
Throughout this week, the price of the pair is expected to decline, reaching the support zone. At the beginning of the week, a brief consolidation and a price pullback upwards to the resistance zone are not excluded. The highest volatility can be expected in the second half of the week.
Potential Reversal Zones:
Resistance:
Support:
Recommendations:
Buying: This will not be relevant in the coming days.
Selling: May be recommended after confirmed signals in the resistance zone.
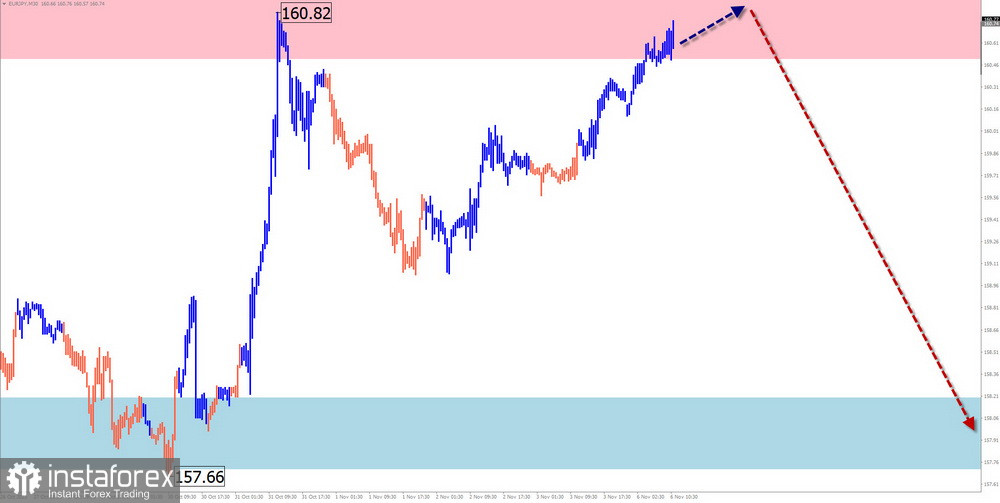
EUR/JPY
Brief Analysis:
The current wave pattern of the euro against the Japanese yen is directed upwards. The unfinished section started counting on July 28th. Over the last three months, the price has been forming the middle part of the wave (B). The descending section from October 31st has reversal potential.
Week Forecast:
In the next couple of days, expect a flat setup with price movement along the resistance zone. Expect the continuation of the cross rate's price decline in the second half of the week due to increased volatility. The calculated support indicates the lower boundary of the anticipated weekly range.
Potential Reversal Zones:
Resistance:
Support:
Recommendations:
Buying: This carries a high degree of risk and may lead to losses.
Selling: This will become possible after the appearance of reversal signals from your trading systems in the resistance zone.
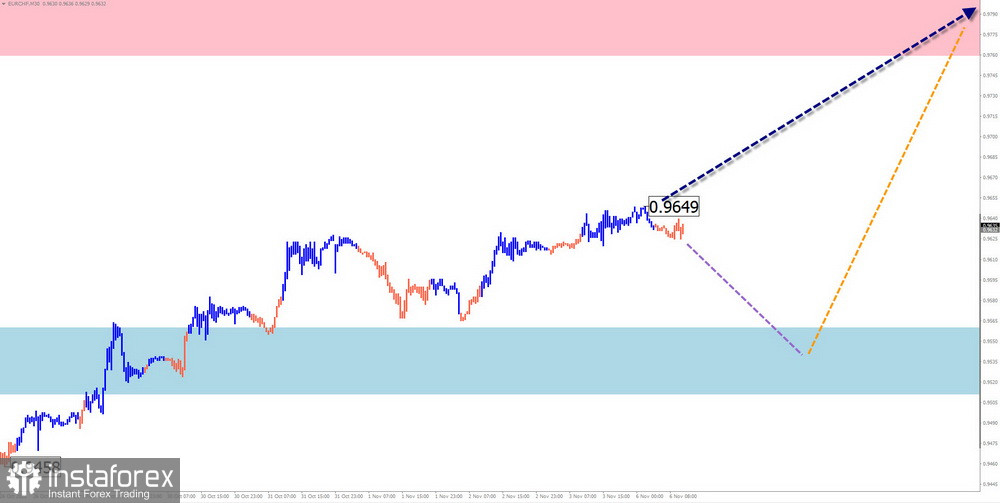
EUR/CHF
Brief Analysis:
The direction of the euro/Swiss franc pair since the beginning of this year has been defined by a descending wave pattern. Since October 20th, an ascending segment has developed against the main trend, which has reversal potential. If confirmed, it will mark the beginning of a full correction.
Week Forecast:
Throughout the weekly period, the general upward trend is expected to continue. In the first few days, there is a possibility of a brief downward movement not below the support. The highest activity can be expected closer to the weekend. A breakthrough beyond the calculated zones within the weekly range is unlikely.
Potential Reversal Zones:
Resistance:
Support:
Recommendations:
Buying: Fractional lots can be used within the day.
Selling: Premature until confirmed signals appear in the calculated resistance area.
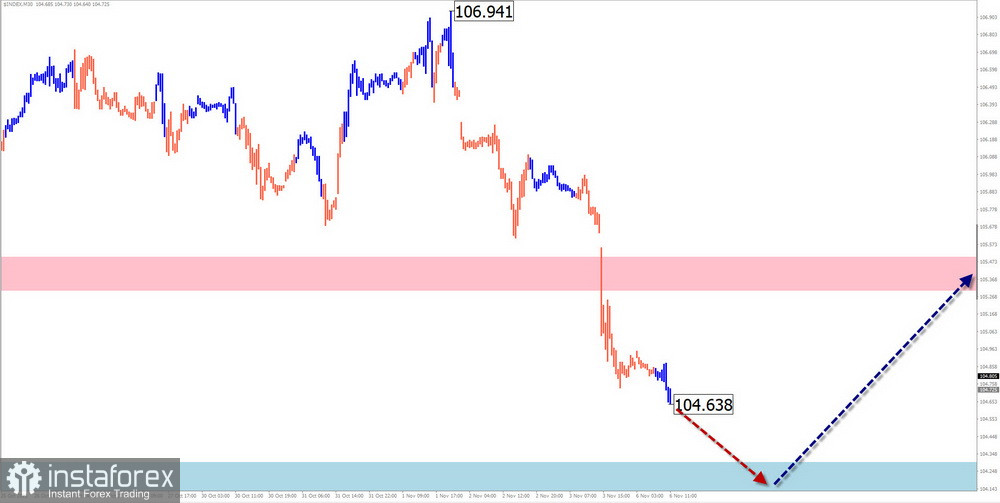
US Dollar Index
Brief Analysis:
The growing trend has brought US dollar quotes to levels from a year ago. Since October 3rd, a descending wave has formed from a powerful resistance zone value, which has become a correction. As of the time of analysis, the structure of this wave appears to have been formed. There are no signals of a reversal on the chart in the near future.
Week Forecast:
In the next several days, the index quotes are expected to continue to decline, down to the calculated support. After that, a sideways movement along its boundary, the formation of a reversal, and an upward pullback of index values are expected. The calculated resistance zone serves as the upper limit of the upward movement.
Potential Reversal Zones:
Resistance:
Support:
Recommendations:
Selling: Selling currencies in major pairs may be possible with reduced volumes during individual sessions.
Buying: Buying national currencies will become relevant after the upcoming index correction is completed.
Notes: In simplified wave analysis (SWA), all waves consist of 3 parts (A, B, and C). The dotted lines show expected movements.
Please note that this analysis is based on a simplified wave analysis and should be used in conjunction with other analysis methods and risk management techniques for trading decisions.